Pie Chart
This widget is used to show a standard pie chart.
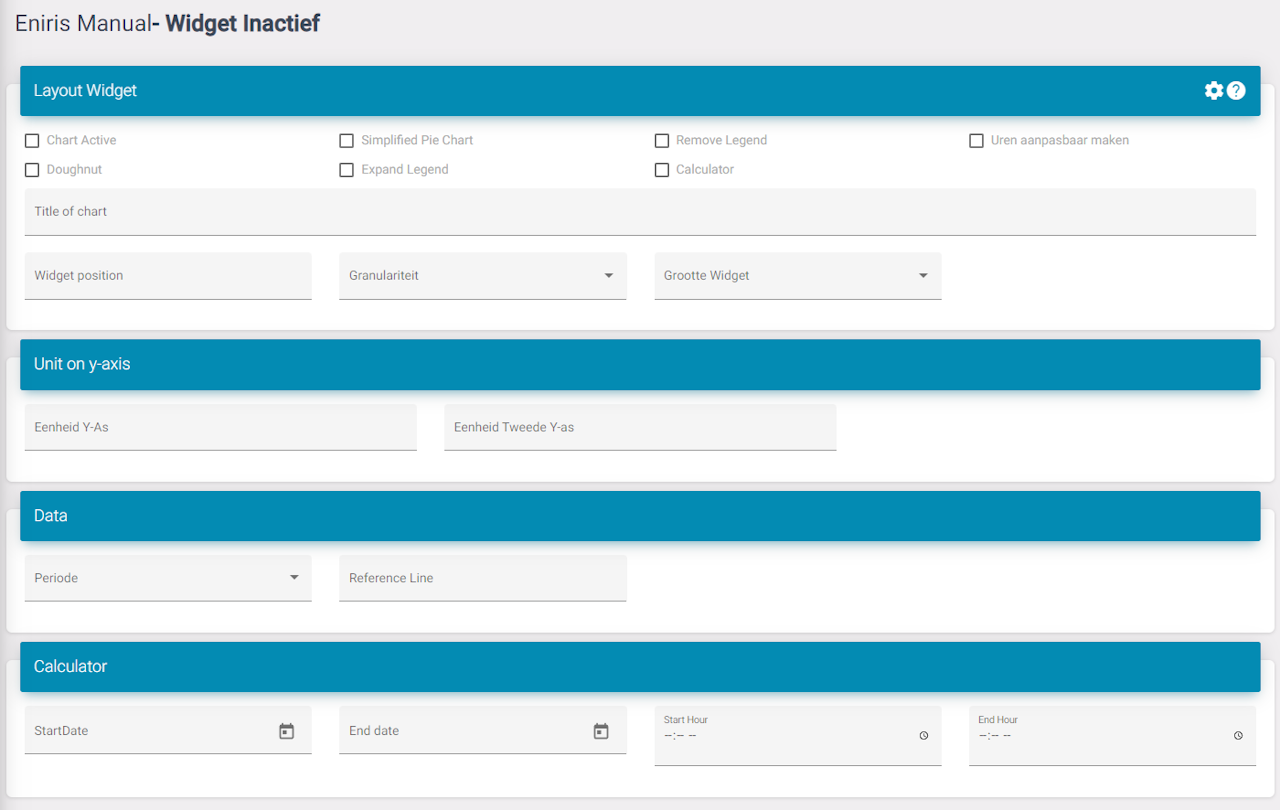
Settings
Chart active: Activate the widget for the dashboard.
Simplified pie chart: A secondary version of the pie chart.
Remove legend: Removes the legend.
Editable hours (Feature): Select the date and also hours. Used to see very specific data on a pie chart.
Doughtnut: Works with the simplified version to make it a donut chart. (Empty inside)
Expand legend: This increases the space underneath the widget allowing more datapoint to be visible without a scroll bar.
Period: Select what the standard period is when the dashboard is loaded. Ex. Month so when you open the dashboard you don't need to edit it so it shows data for a month.
Last updated March 11, 2026Edit this page